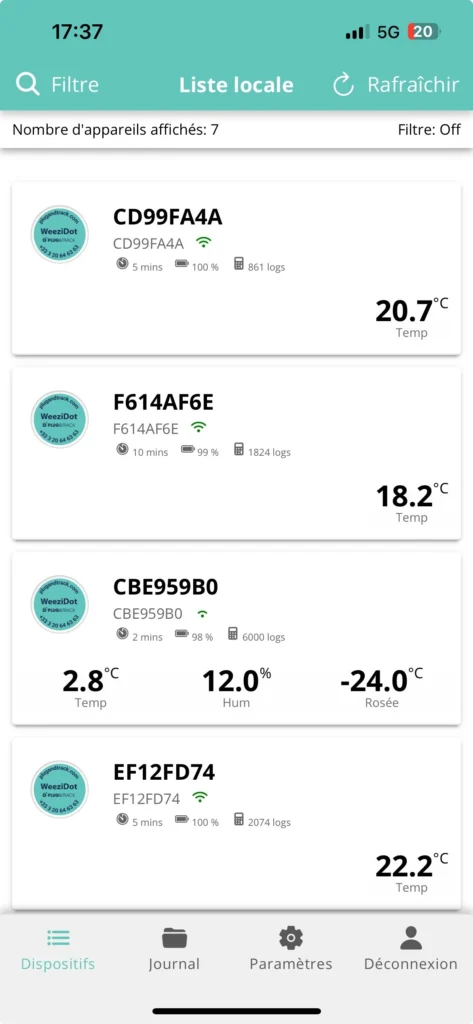
To read a Weezidot, open the WeeziApp application on your device The list of nearby WeeziDots appears on the screen
Select a WeeziDot
View data for selected Weezidot
Select a WeeziDot to view the data. The curve is displayed as follows
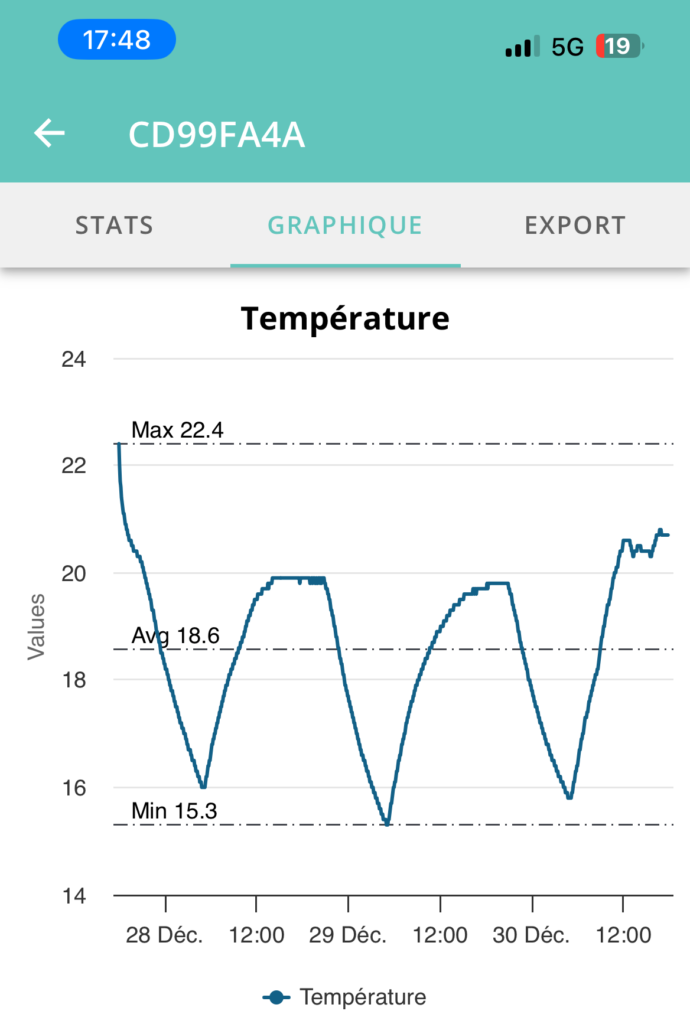
You can zoom in on the curve with your fingers, just as you would with a picture.
View statistics
The Statistics tab lets you see
- minimum, maximum and average values
- the number of values
- Download date
You can select a time range to refine these statistics (with no effect on the curve).
Export and share a curve as a PDF
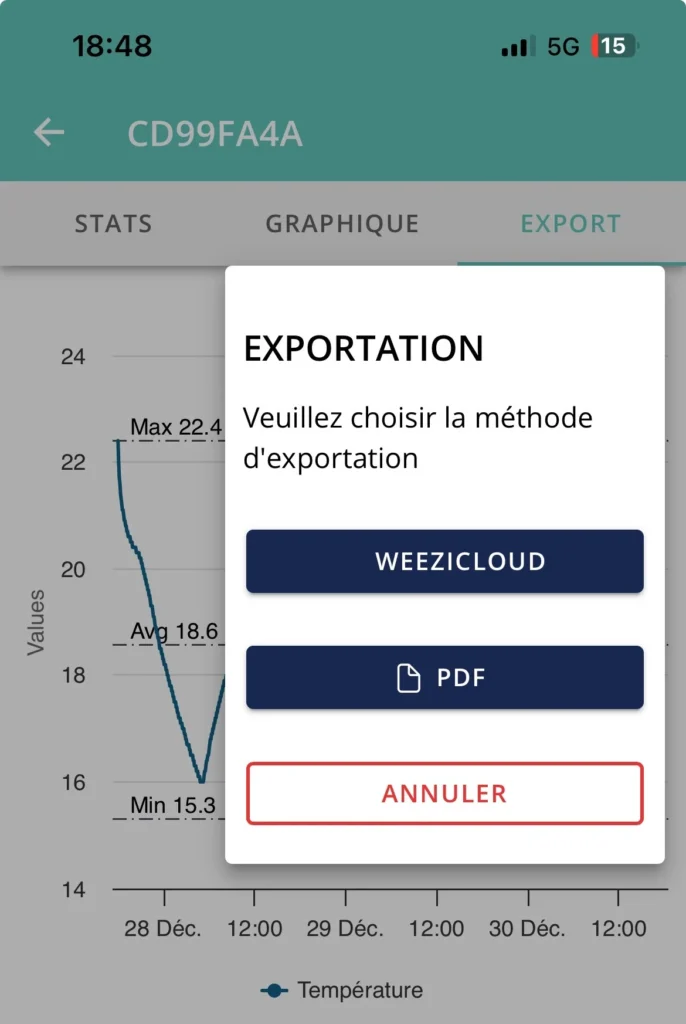
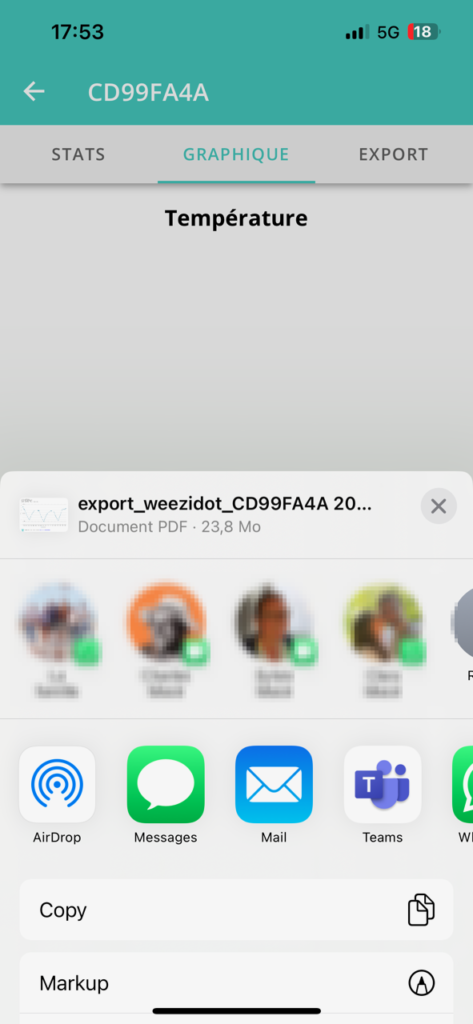
You can create a PDF file and share it with others Click on Export and choose PDF
You can then share the PDF by email, WhatsApp, Teams, SMS or any other sharing application available on your phone.
Transferring data to WeeziCloud
If you have a WeeziCloud account, you can archive and share data with others in WeeziCloud Enter your login and password from the Log in menu Click on Export and choose WeeziCloud

If a mission has been created in WeeziCloud
If a mission has been created in WeeziCloud and has not yet been surveyed (mission in progress), the survey data is automatically saved for this mission.
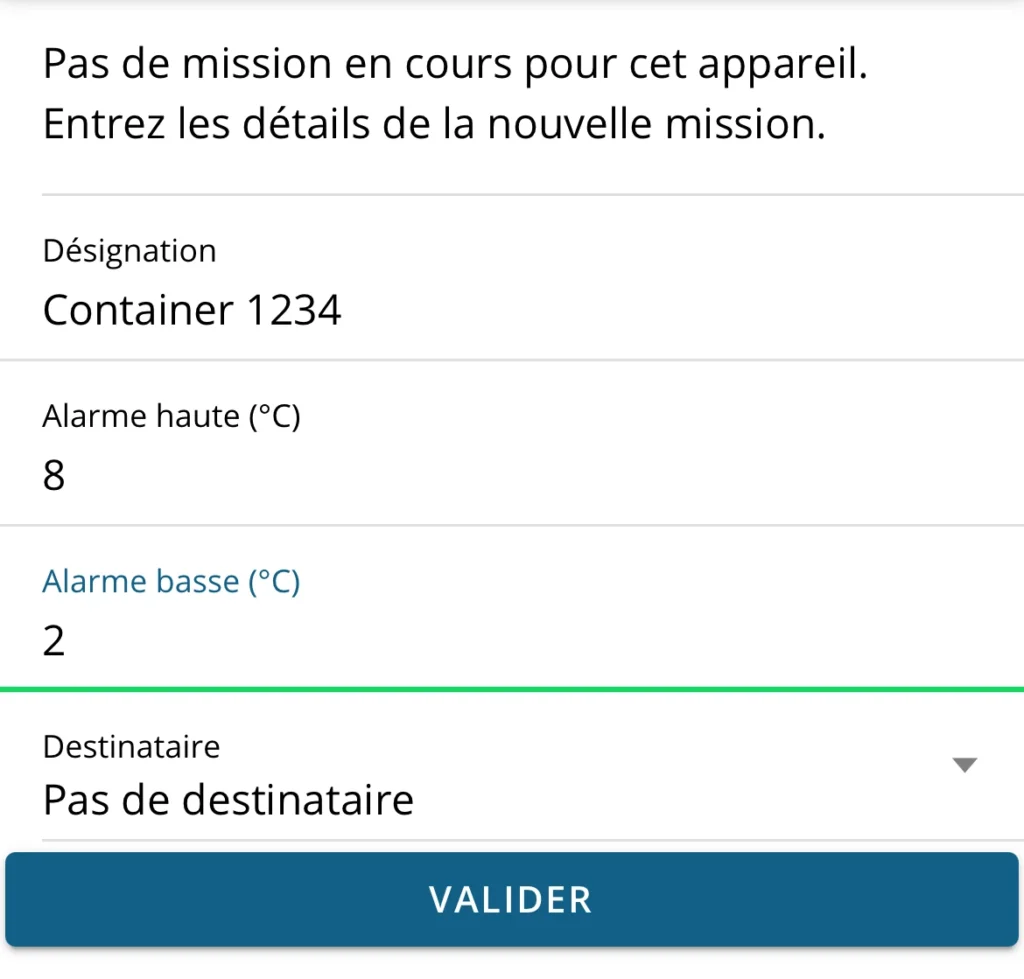
If there are no missions outstanding on WeeziDot
If no mission has been created in WezziCloud or if it has already been recorded, you must enter :
- A name for this mission (mandatory)
- High and low alarm thresholds (optional)
- Recipient (the person will receive an email notification) (optional)
