Graph
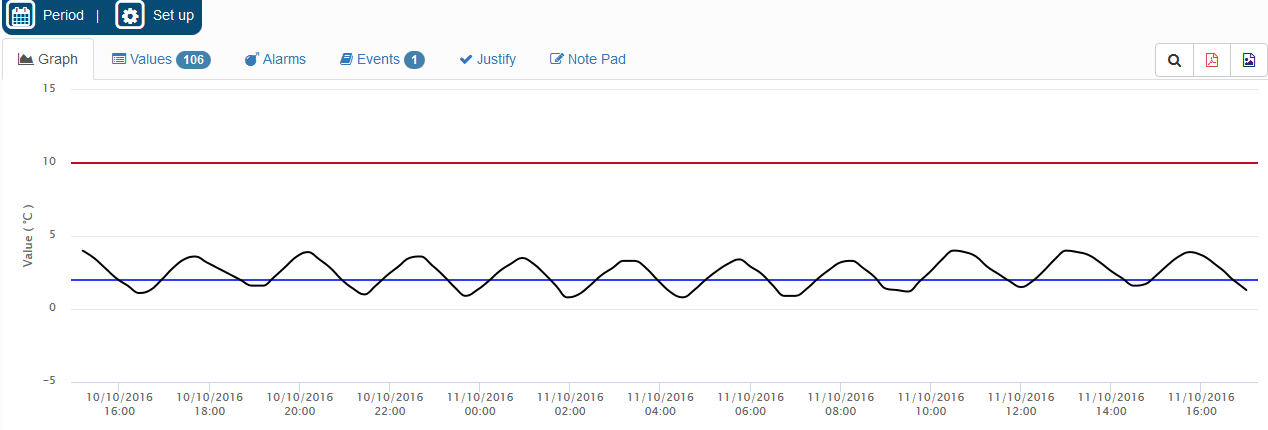
The graph shows the values and the high and low alarm thresholds.
By default, the graph shows the values of the last 24 hours, but you can also select another period of time.
You can make a zoom on the graph by moving the cursors. This zoom will be active in the list of temperatures as well.
Values
This tab gives the list of measurements, min, max, average and MKT (Mean Kinetic Temperature)
Values are displayed in red in case of high alarms or in blue in case of low alarms.
Events
The list of Events gives the detail of each modification of a sensor (date and time of the modification, person, setting modified).
Justify
You can select an alarm and enter a justification, i.e. a corrective action to close the alarm.
Note Pad
You can enter your notes concerning the Equipment.
You can also directly access this tab with a double click on Equipment in the list of the Equipments in alarm, situated in the home page.
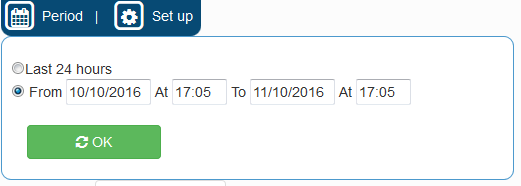
Modification of the period of analysis
By default, you get the last 24 hours. Open the detail of an Equipment, select Period and change accordingly. This period will be the same until you log off.
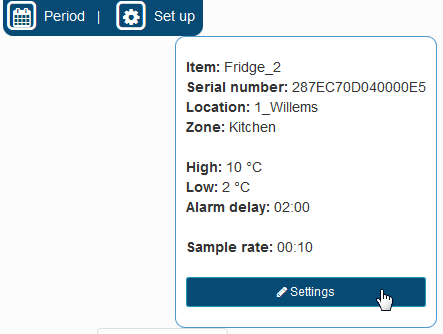
Quick change of settings
Open the detail of an Equipment and press “Settings”.