Press the ‘Relève’ icon and place a Button on the player. You have access to :
- tabs: Status, Alarms, Temperatures, Curve and Notepad
- action buttons: “Sterilize / Pasteurize”, “Stop mission”, “Archive”, “Export”, “Print” and “Close”.
Status :
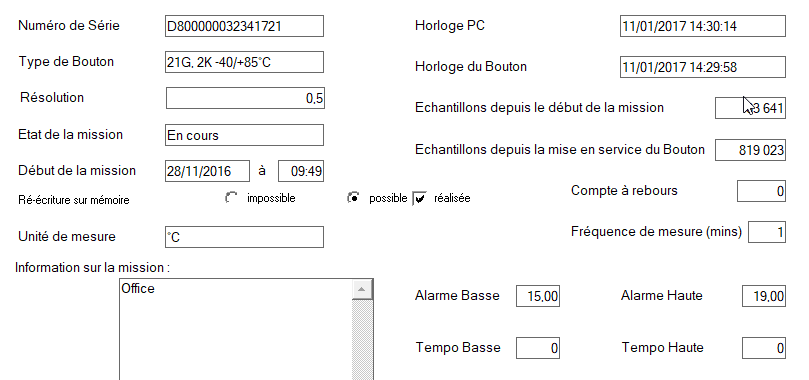
Thermotrack displays the following information:
- Button serial number
- Button type
- Resolution chosen for this mission
- Mission status: Outstanding, stopped, waiting for alarm.
- Mission start date and time
- Mission start when an alarm is exceeded: this box will remain checked when the Button has started recording and the mission status is ‘in progress’. The status of this checkbox will remind you that your Button was programmed to start only after the first alarm.
- Rewrite to full memory (Allowed or not, performed or not)
- Real-time clock for PC and Button
- Number of samples since start of mission
- Number of samples since the Button was put into service; this value gives you an indicator of the Button’s service life.
- Countdown (remaining time)
- Measurement frequency
- High and low alarm levels and timer levels
- Mission information (given in the Button’s free memory)
Alarms :
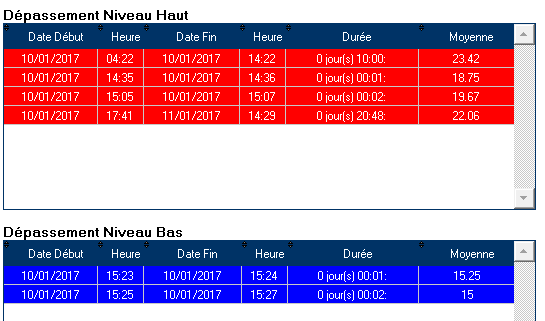
This window tells you whether the alarm and delay levels you have set have been exceeded. Each Alarm has a beginning and an end, which constitute a period. The Button can store 12 high and low alarm periods. For each period, you have the total time and the average temperature during that period. Thermotrack also calculates the total time for all alarms. Red and blue alarms correspond respectively to high and low temperature overshoots AND timer overshoots Orange alarms correspond to temperature overshoots WITHOUT timer overshoots If you have authorized rewriting to full memory (see “Mission” chapter), the average temperature of certain alarm periods may be displayed as N/A (Not Applicable), as the values relating to these periods will have been progressively erased. In fact, when rewriting, the Button retains the alarm level exceeded information, but loses the values associated with that period.
Temperatures :
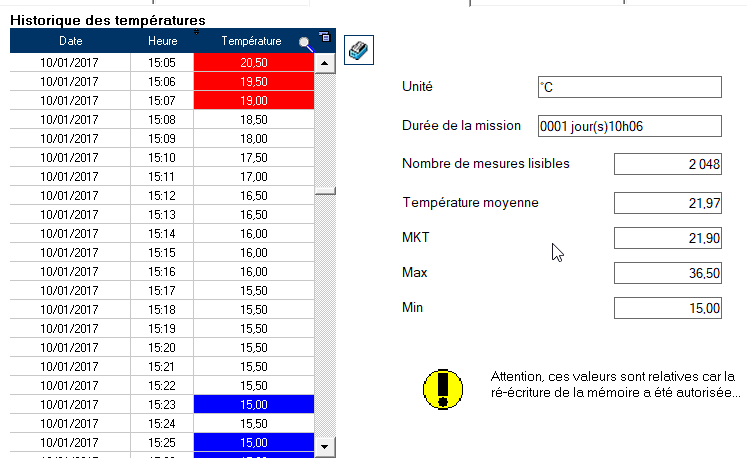
Selecting this tab gives you access to the list of temperatures measured (the last 2048 if loop writing is used).
- Dates and values in blue correspond to low-level exceedances of alarm levels.
- Dates and values in red correspond to high exceedances of alarm levels.
By clicking on the “Date” or “Temperature” column, you can sort the data in ascending or descending order. By clicking on the magnifying glass to the right of these two columns, you can enter a value and Thermotrack will display the first value recorded. The button on the right of the table allows you to reorder the values in the order in which they were recorded. The right-hand side of the window displays the number of available values, the average temperature, and the highest and lowest points.
Curve
The measurement curve is displayed directly on the screen.
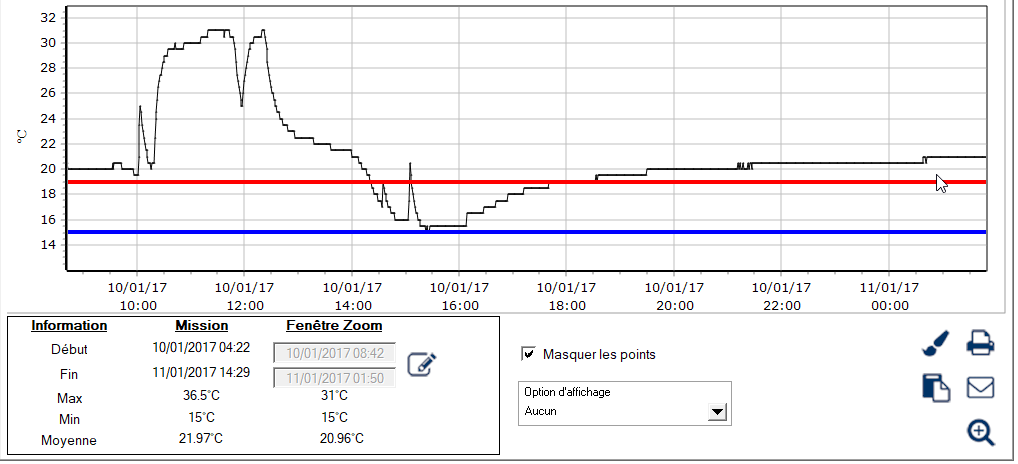
Zoom in on the curve :
You can select a part of the curve and zoom in on the period with the mouse. Select a point on the curve, click and hold the left mouse button. Move the mouse down to the right, to the point to be reached, and release the mouse button. The curve adjusts to the selected frame.
Display option :
You can display the labels corresponding to temperature values, time values or both on the curve. To do so, select the corresponding option from the list below
Send a graph by email :
You can send an image of the graphic directly, as it appears on the screen, by pressing the email button. Choose the format of the image to be attached to your e-mail (JPEG and GIF are recommended); BMP format is larger and will take longer to send. An email is prepared directly, with the image attached, whose name is composed of the Button’s serial number and the date and time of the reading.
Displaying points on the graph :
You can display or hide points on the curve. Click on the corresponding button to switch from one to the other.
Table ‘Information ‘ :
This table summarizes the mission and zoom window, indicating the start and end of the period, the highest and lowest points and the average temperature.
Notepad :
Notepad is your workspace for jotting down what you want, and creating customized reports. You can enter text, format it using the icons and use the spell-checker. To do this, go to the alarm list, right-click in the list, select copy or copy all, then return to the notepad and right-click ‘Paste’. You can also copy the graph using the copy button on the right of the screen, then resize the image from one of the corners. Finally, you can print out your report Convenient: If you archive the statement, the report and its contents are saved with it. Any subsequent modifications will also be saved directly.
Archive
You can archive temperature readings. Once you’ve read a Button, press the “Archive” button and enter a Label, Author and Comment. In the category window, choose the category in which you wish to place your archive, then validate with the “OK” button. You can add a new folder by clicking on the right mouse button. See also the automatic archiving options in paragraph 3.2 Archiving.
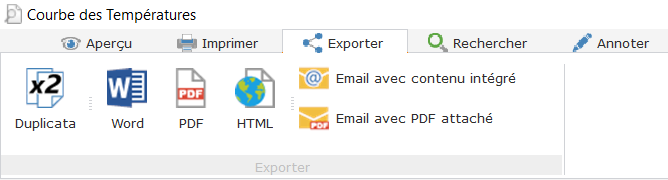
Export :
You can export temperature readings to Excel from this button
Print :
You can choose to print :
- Alarm list
- Temperature list
- The curve
- The notepad
Once you’ve selected the report you want to print, Thermotrack gives you a print preview. From this preview, you can :
- Export to Word
- Send status by email (send image)
- Email as PDF
- Creating a PDF document
To customize reports (your logo or address can appear on each report you print), see paragraph 3.3 Customized footers.
Sterilization / Pasteurization
Thermotrack allows you to calculate VP and VS. Simply press the “Ster. / Past.” button at the bottom of the readout screen. Select the process to be tested:
- Pasteurization: By default, T is set to 70, z to 10.
- Sterilization: By default, T is set to 121 and z to 12
- Manual: Here you can specify the T and z
You can also choose temperature selection criteria (temperature above xx’ or between xx and yy’ ). Depending on these parameters, the different periods are displayed, with start date, end date, duration and value reached. There’s a very quick way of checking the success of the sterilization or pasteurization process. From the ‘Ster. / Past.’ icon in the main menu.
- First of all, assign a Button to a VP or VS:
You can quickly assign a Button to perform a VP or VS calculation, using the icon on the main menu. In this case, your Button will be activated on the basis of the measurement frequency and alarm delay defined in the “Mission” menu “Sterilization / Pasteurization configuration”. - At the end of the process, use the “Ster. / Past” icon. A window appears, displaying the message “Process successful”. You can then choose to close the window or open the full report.