The Mapping module enables you to check whether your equipment is stable and homogeneous, and to issue reports in compliance with ISO 60038-3-5, which define the criteria for testing the conformity of climatic chambers (warehouses, cold rooms, refrigerators, ovens, isothermal boxes, etc.).
License
The Mapping module requires the purchase of an additional license. Please contact your distributor for more information. The module is installed with your Thermo Track software. Simply activate the license. Enter the access code that corresponds to this module and your Button reader. This code is different from that of Thermo Track PC.
Create a new Mapping
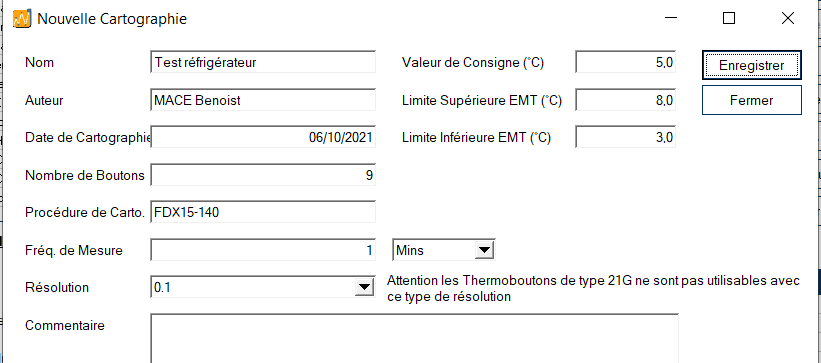
- Click on the “New” button in the top right-hand corner.
- The window then appears, in which you must enter the information specific to the mapping (Name, Author, Procedure) as well as the buttons to be set (Number, Resolution, Measurement Frequency, Setpoint, Upper and Lower Limit of Maximum Tolerated Deviations). MTDs are the tolerance limits that must not be exceeded to achieve compliance.
- All Thermo Buttons in your mapping will be missionned according to these parameters. The mapping date is automatically the current date.
- Once all the fields have been completed, click on “Save”.
Programming Thermo Buttons
You can then assign your buttons for mapping.
- The mapping module lets you assign your Buttons (up to 50 per mapping ) by programming them all in the same way and assigning them a coordinate or name (Top, Bottom, Middle, …), depending on their position in your enclosure.
- Enter the name corresponding to the position of the Thermo Button in your enclosure.
- Click on “Mission” to program the Thermo Button, according to the parameters entered previously.
- Press “New Button” to program the rest of your Thermo Buttons used for this mapping , one after the other.
Thermo Buttons
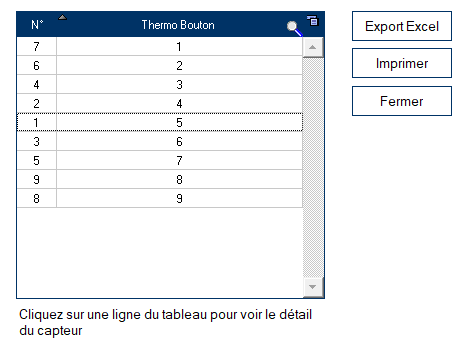
- Press “Download” to read the data from your Thermo Buttons and find out the results of your mapping.
- Place Thermo Buttons one after the other on the reader, until the last Thermo Button is read.
- All buttons are automatically read and archived one after the other.
- An initial graph automatically superimposes all the curves, enabling you to check when the temperatures of the various Buttons have stabilized (steady state).
- Select the period corresponding to the stability period.
- Then press the “Validate” button
Judgement and test report
You then get the full report, telling you whether your enclosure is “Compliant” or “Non-compliant”.
The conformity decision is guided by the set of averages for each sensor. If all these averages plus or minus their uncertainties lie between the maximum tolerated high and maximum tolerated low deviations, the software will indicate that the mapping is compliant. It is possible to modify the conformity decision to suit your own requirements. In this case, you should indicate your compliance parameters in your own procedures or in the Thera PC notepad. In this case, you should indicate your compliance parameters in your own procedures or in the Thermotrack PC notepad.
This graph shows sensor averages with MTDs. These values can be found in the “Results table” tab.
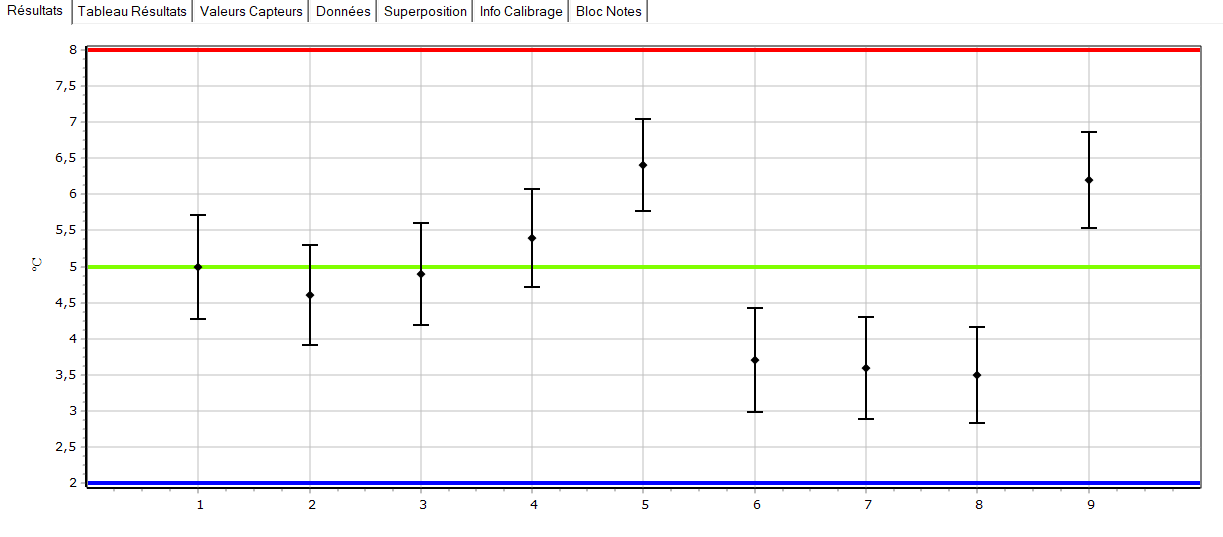
You’ll also find the graph where the curves of the various sensors are superimposed (“Curve superimposition” tab).
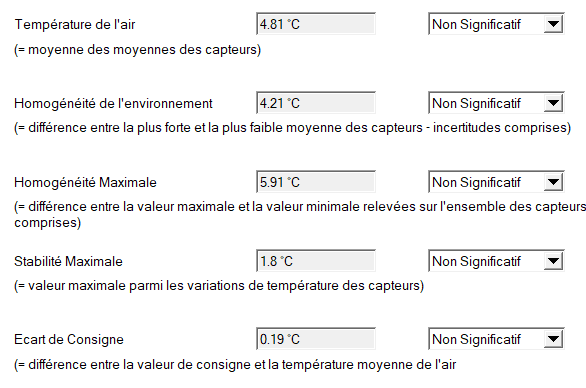
The mapping module automatically calculates (“Data” tab) :
- Average, minimum and maximum values for each recorder.
- Air temperature.
- The homogeneity of the environment.
- Maximum homogeneity.
- Maximum stability.
- Setpoint deviation.
The “Calibration Info” tab lets you find out whether your Thermo Buttons have been calibrated, and the validity date of the calibration certificate. Notepad” lets you create a customized report. You can obtain the details of a Thermo Button by clicking on its name in the table at the top right of the mapping details.
You can also export all data to Excel.